Natural Gas Storage Preview: Week Ending Nov 6
What to know before Thursday's EIA report: the 5-year average for the week ending Nov 6 is a 40 Bcf injection; last year it was a 43 Bcf injection.
EIA's next storage report comes out Thu Nov 12 at 10:30 a.m. ET and covers the week ending Nov 6. Here's what happened that week.
The comparisons
- 5-year average change for this week: a 40 Bcf injection.
- Same week last year: a 43 Bcf injection.
- Last week's report: a 77 Bcf injection (week ending Oct 30).
Demand during the storage week (Oct 31–Nov 6)
| This week | Week before | Same week last year | Normal | |
|---|---|---|---|---|
| Heating degree days (gas-weighted) | 80 | 63 | 98 | 94 |
| Cooling degree days | 6 | 7 | 1 | 7 |
| Gas-fired power (TWh) | 30.8 | 30.1 | 25.8 | — |
Heating demand was higher than the week before, and power burn was higher.
Storage
Week ending Oct 30: 3,801 Bcf after a 77 Bcf injection
| Comparison | Bcf | Difference |
|---|---|---|
| 5-year average | 3,747 | 54 above (1.4%) |
| Last year | 3,910 | 109 below (2.8%) |
By region vs. 5-year average (Bcf): South Central −13, Mountain +10, Pacific +13, Midwest +22, East +23.
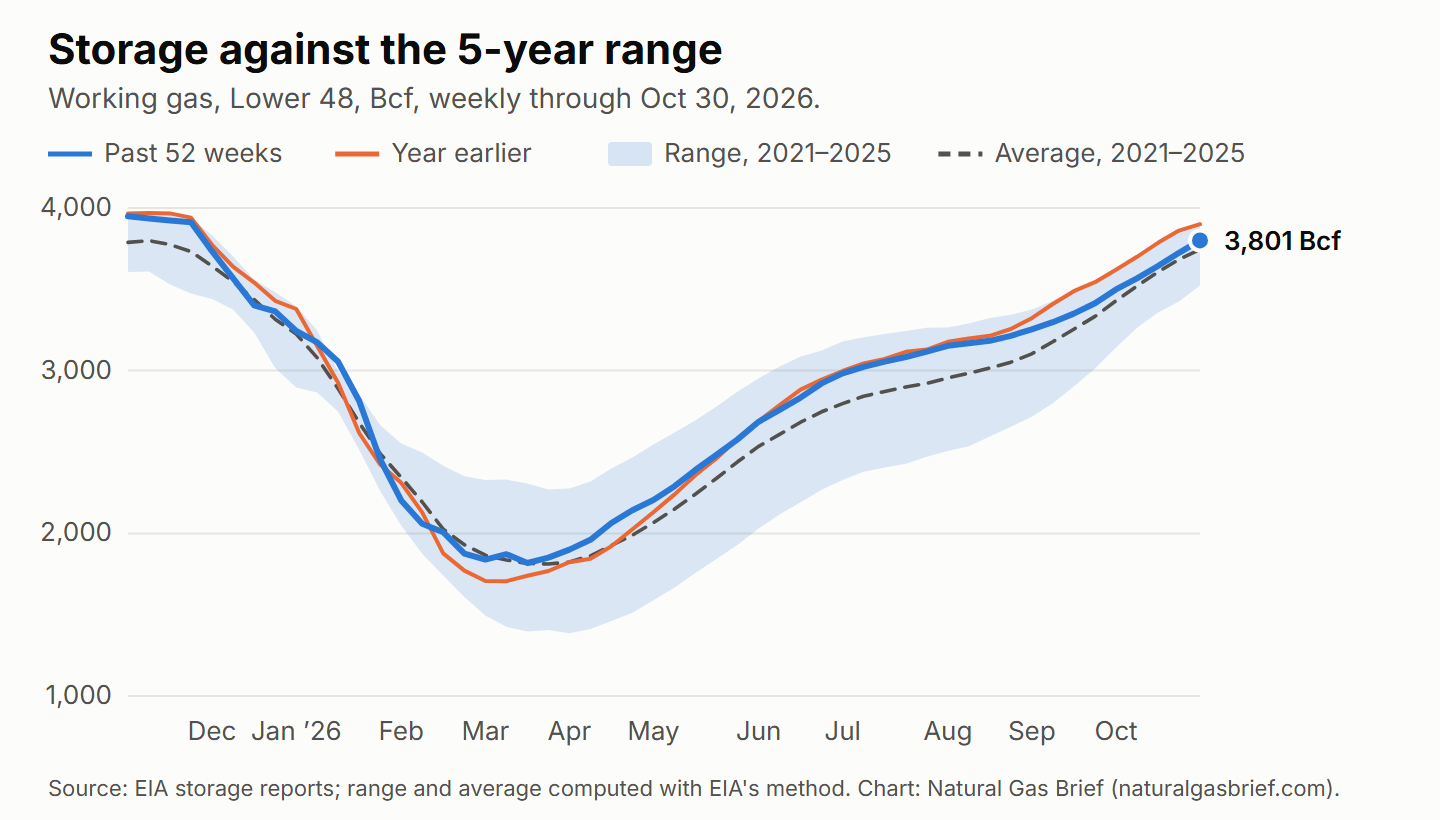
Reading the chart: The thick blue line is Lower 48 working gas over the past 52 weeks, one point per EIA report; the shaded band is the 2021–2025 range for each week, the dashed line their average, and the orange line the year before. At 3,801 Bcf for the week ending Oct 30, storage is within that range, which runs from 3,524 to 3,912 Bcf this week. Over the 52 weeks it peaked at 3,950 Bcf (week ending Nov 7, 2025) and bottomed at 1,818 Bcf (week ending Mar 20, 2026), and it was above the 5-year average in 45 of them.
Disclaimer: Natural Gas Brief is published by Googans Island LLC for information and education only. It is opinion and general market commentary, not investment, trading or financial advice, and not a recommendation to buy or sell any security, commodity or futures contract. Nothing here is a trade signal or tailored to any reader's situation. Trading natural gas futures and related products involves substantial risk of loss. Data comes from public sources believed to be reliable but isn't guaranteed. The publisher may hold positions in natural gas–related instruments. Full disclaimer
This brief is generated automatically from public data, and its numbers are checked against the source data before publication.
Sources: EIA Weekly Natural Gas Storage Report; NOAA Climate Prediction Center degree days, 7-day forecasts and 6–10/8–14 day outlooks; EIA Hourly Electric Grid Monitor; CFTC Commitments of Traders. Normals are 10-year averages (2016–2025).